The Coffee Industry
>Industry overview
- Key facts: > 9.5M tonnes of coffee (9.5 billion kg) is produced annually. The total trade value is US$30.9 billion (2019)
- Coffee is the world’s most widely traded tropical agricultural commodity (ICO, 2011).
- Every day, the world drinks around 2 billion cups of coffee.
- Raw materials: There are approx 12.5 million coffee farms in around 70 countries, termed the “bean belt”.
- Each farm produces an average of 0.75 Tonnes of coffee.
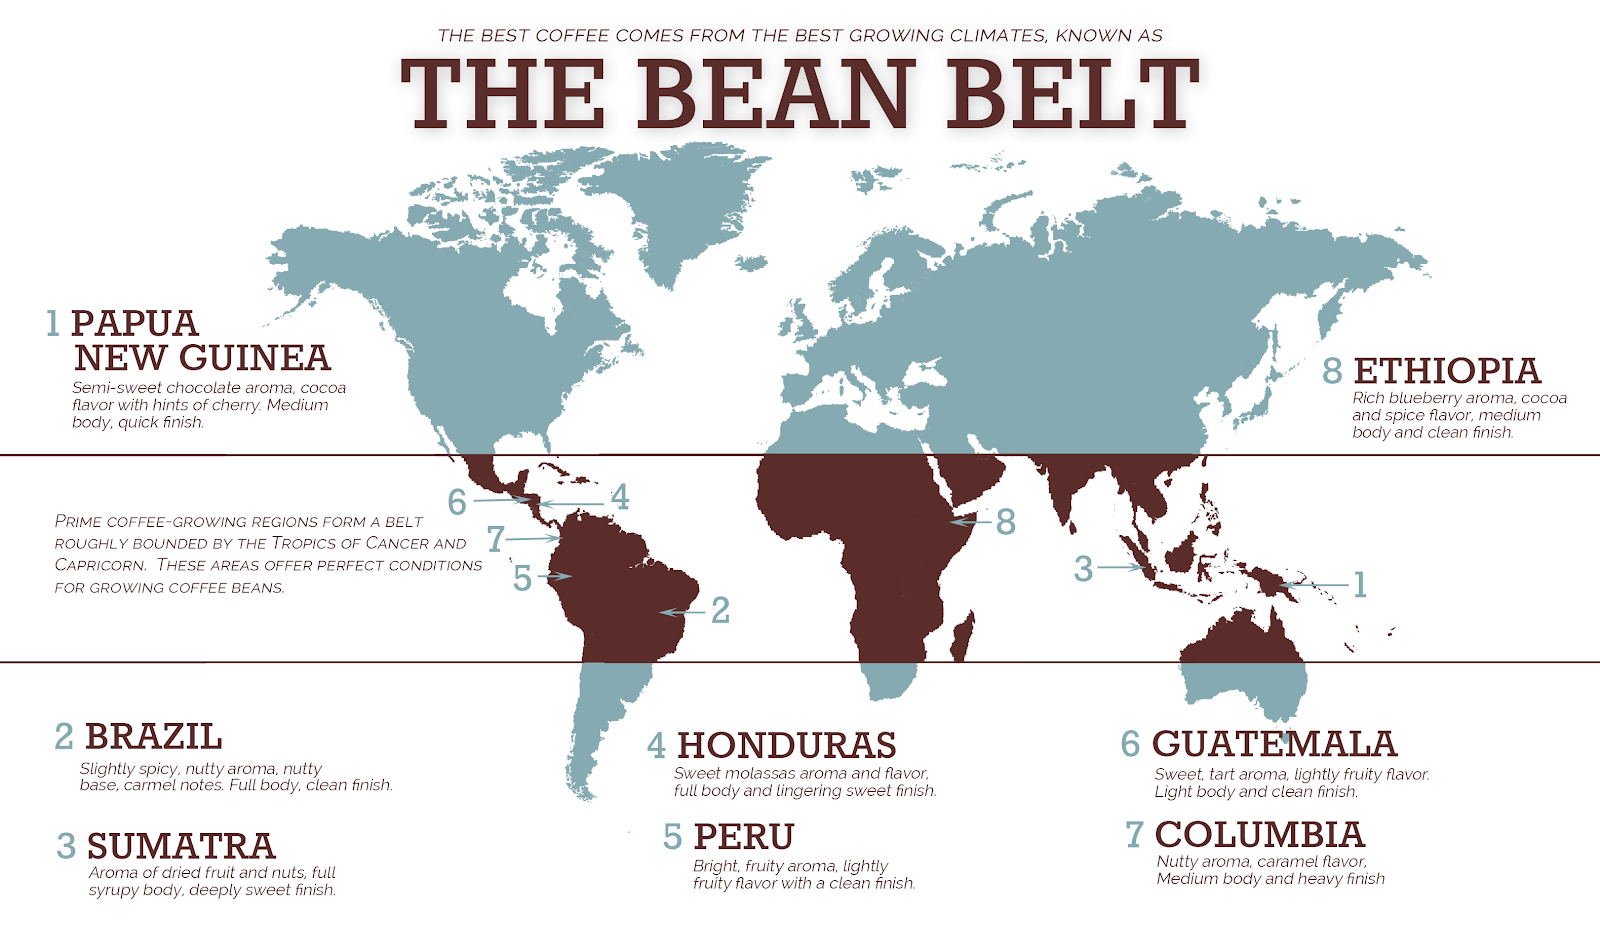
- A global industry: Coffee is grown in tropical countries, but mostly consumed in North America and Europe. A global supply chain means intercontinental transport by plane or cargo ship, which adds to the carbon footprint.

- Industry forecast: Due to growing market demand in Asia and Oceania, coffee is expected to triple production by 2050, raising pressure on forests and other habitats. It is important to rethink our environmental impact and reduce our carbon footprint as the industry growth accelerates.
- The main players in the global coffee industry:
- Source: Mordor Intelligence

> Coffee Production
What is the coffee life cycle?
Coffee production is a multi-stage cycle. There are multiple areas where companies could innovate and exploit opportunities to reduce their environmental impact.
–Harvesting: by hand or machinery
–Shelling: Remove fleshy outside layer, pulp is composted
–Drying: Depulped beans dried to 12% moisture (by sun or machinery)
–Dissolution: For decaf – dissolve caffeine
–Roasting: Roast beans to over 200 C (only 10 degree difference between light roast and dark roast)
–Freeze drying: Instant coffee is freeze dried
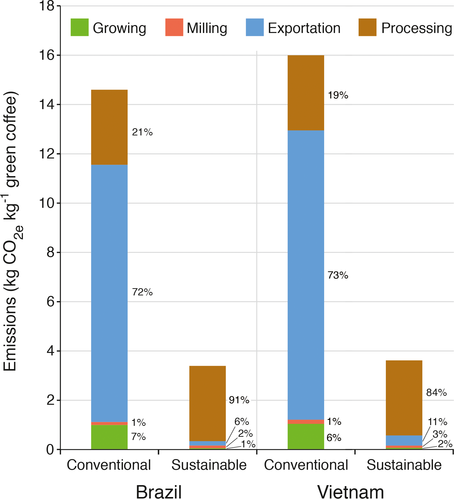
The graph below shows the issue resources at each stage of the total coffee process (growing, milling, exporting and processing):

Yield: 1kg of “green coffee” makes 56 espressos
Carbon footprint: coffee industry
-The full carbon footprint of coffee “from bean to cup” is estimated at 59.12 g CO2e per cup of coffee (PCF Pilotprojekt Deutschland, 2008).
– In calculating the footprint of a “cup of coffee” it is important to understand the impact of the actual coffee, heating the coffee and the additional footprint of
Comparing the footprint of tea and coffee:
The carbon footprint of a cup of tea or coffee:
21g CO2e: black tea or coffee, boiling only the water you need
53g CO2e: white tea or coffee, boiling only the water you need
71g CO2e: white tea or coffee, boiling double the water you need
235g CO2e: a large cappuccino
340g CO2e: a large latte
Source: Mike Berners Lee (Guardian Article)
Breakdown of the main contributors to carbon footprint (Brazil and Vietnam)
- Carbon dioxide: Weight for weight, coffee produced (by the least sustainable means) generates as much carbon dioxide as cheese and has a carbon footprint of almost 50% one of the worst offenders – beef.
- Growing phase: Fossil fuel use (66% and 39%) and electricity use (16% and 51%) are the largest emission sources in the growing phase. (Brazil and Vietnam)
- Milling phase: Fossil fuel is the largest emission source, contributing 96% and 84% of emissions in Brazil and Vietnam, respectively.
- Transporting: Growing 1kg of arabica coffee in Vietnam or Brazil and transporting it to the UK produces greenhouse gas emissions equivalent to 15.33 kg of carbon dioxide on average.
- Source: Wiley
Comparing to beef (weight for weight)
- While coffee has half the footprint of beef weight for weight it is important to understand the impact of typical portion sizes
- An average cup of coffee will have 8 grammes per serving whereas a typical serving of beef will be 100 grammes (Mayo Clinic) and average recommended daily US intake of 160 grammes.
- So the portion size of a cup of coffee (8 grammes) will be 12.5% the size of a average beef serving (100 grammes) and 6.25% of the carbon footprint of a serving of beef
- These comparisons are for normal production of coffee. Sustainable coffee has a much lower footprint (see below)
- Coffee is plant based compared to beef which is ruminant based
> Conventional production vs Sustainable production
- The total carbon footprint of conventional coffee production was 36 and 22 times higher than sustainable production in Brazil and Vietnam, respectively.
Conventional vs sustainable growing: Just one espresso has an average carbon footprint of about 0.28 kg, but it could be as little as 0.06 kg if grown sustainably.
This data is based on a detailed life cycle assessment of the carbon equivalent footprint of coffee produced in Brazil and Vietnam and exported to the United Kingdom.
Conventional v Sustainable Carbon Footprint
Results on the average carbon footprint of Arabica coffee from both countries:
kg of carbon dioxide equivalent per 1 kg of green coffee (kg CO2e kg−1 )
- 15.33 (±0.72) kg for conventional coffee production
- 3.51 (±0.13) kg for sustainable coffee production.

There is currently no data available on the split between conventional and sustainable coffee production but we can extrapolate that the total Global footprint sits in a range between

What drives the difference in the Footprints?
The 77% reduction in carbon footprint for sustainable coffee production was driven by two causes. The transportation of coffee beans via cargo ship rather than freight flight and the reduction of agrochemical inputs. The transportation factor is by far the most significant.
The research team also identified that further reductions could be made through optimal use of agrochemicals; reduced packaging; more efficient water heating; renewable energy use; roasting beans before exportation; and carbon offsetting. The team saw opportunities in using certification schemes to implement the other environmental impacts of coffee cultivation.
https://www.sciencedirect.com/science/article/abs/pii/S0959652614001474
How could the coffee industry lower its carbon footprint?
Land use:Interestingly – coffee plants capture approximately 35% as much CO2 as the same area of woodland. (source)
Corporate solutions: starbucks sustainable coffee challenge, 99% ethically sourced, traceable Nespresso AAA sustainable quality program, aims to reduce the carbon footprint of a cup of Nespresso coffee by 28% by 2020 in comparison to 2009 (Nespresso, 2019b). Strategies in the programme range from designing more efficient coffee machines to agroforestry and are informed by life cycle assessments (LCAs).
Transporting: the use of cargo ships for the transportation of coffee beans from the production countries to the United Kingdom instead of freight flights reduced estimated emissions by 10.3–11.3 kg CO2e kg–1 green coffee. Transportation via cargo ship takes 24 times longer from Brazil and 48 times longer than Vietnam. However, ships carry far more coffee beans than planes, reducing the number of journeys. This “slow travel” in the supply chain could greatly help reduce the carbon footprint. (source)
Crop production: Using renewable energy in crop production can reduce the carbon footprint of crop production by up to 70%. (source)
Roasting before exporting: Roasting coffee beans reduces their weight by more than half but the volume remains approximately the same. This makes a big difference to air freight which is focused mainly on weight but less important for international shipping that is mainly concerned with volume. Roasting the coffee beans before exporting them could reduce the carbon footprint where air freight is used.(source)
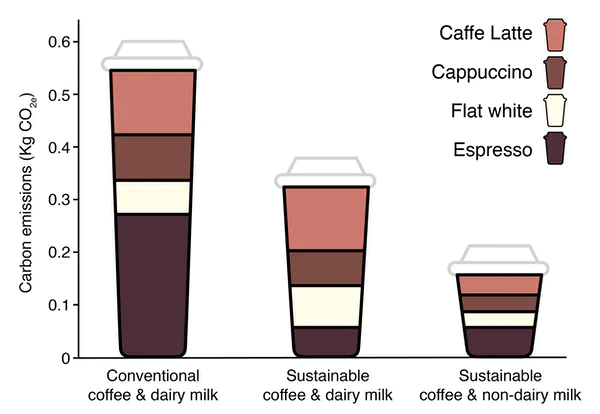
Carbon footprint: Coffee drinks
Conventional Production Sustainable Production
Lattes 0.55kg 0.33kg
Cappuccinos 0.41 kg 0.20kg
Flat whites 0.34 kg. 0.13kg
Canned coffee: 0.76 kWh and 223 g CO2 per serve.
Latte: 0.54 kWh and 224 g CO2 per serve.
Espresso coffee: 0.13 kWh and 49 g CO2 per serve.
Canned coffee: Despite only holding around 17% of the coffee market share, canned coffee products contribute around half of the national carbon footprint from coffee consumption. source: Science Direct
Milk: the question of methane emitted from cows and the carbon footprint of the dairy industry also needs to be taken into account when consumers add milk to their coffee.
How can coffee consumers lower their carbon footprint?
Home brewing: During the lockdown, sales of supermarket coffee and home brewing or coffee machines increased dramatically [The Guardian]. While consumers avoid the waste associated with takeaway coffee cups, coffee machines use a significant amount of energy. Since 2013, coffee machines sold in the EU must have a power management function that automatically switches the machines to a standby or off mode after the shortest possible time period of intended use (Josephy et al., 2013).
Water usage: “how you prepare your coffee at home can add 50% or more to its overall environmental footprint.” When you boil a full kettle of water, the energy expended is greater than the total energy expended in producing and transporting the cup of coffee to you. (The Conversation) Numerous articles encourage consumers to only boil as much water as they need.
Glass Jars: Highly recyclable and not particularly energy-intensive to produce. However, glass is very heavy compared with other materials. Fewer glass jars can be transported than a lighter alternative, adding to transport costs and carbon footprint. (The Conversation)
Pods: Pod-style systems in fact use less coffee and electricity per cup. However, excessive packaging waste contributes to their overall carbon footprint. They are also the bulkiest form of transport, fitting the least servings per vehicle, thus increasing transport costs and fuel use. They are heavily processed and not recyclable. (Source: Wiley)
Recycled plastic: Arena et al. (2003) estimated a carbon footprint reduction of up to 85% where recycled plastic was used to produce packaging in comparison to virgin plastic.
Single use/disposable coffee cups: The standard ‘to go’ coffee cup is made from paper, but coated in polyethylene – this keeps the coffee hot for longer and prevents the paper cup from collapsing. However, it makes it impossible to recycle! 6.5 million trees are cut down by the disposable coffee cup industry each year, and the production process uses as much energy as powering 54000 standard homes annually. By using one disposable cup a day, you generate 10kg of waste per year. (Source: Green Match)
Coffee cup lids: typically made from polypropylene or polystyrene #6, a petroleum-based plastic that is difficult and unprofitable to recycle.“The sorting, cleaning, and melting of polypropylene is more expensive than creating virgin or new polypropylene lids.” Consider asking for coffee without the lid to save on plastic waste. (Source: Green Match)
Coffee stirrers: not ethically sourced or recyclable. Consumers are recommended to get in the habit of bringing a reusable spoon and fork with them, and using the spoon to stir if needed.
Reusable cups: It requires resources, energy and manufacturing to create reusable cups, but these products have a much longer lifecycle and help to reduce environmental impact. A reusable coffee cup reaches a break-even energy output at around 17 uses.
How does drinking 1 cup of coffee per day contribute to carbon emissions?
Results from BBC Carbon Footprint calculator.


Other Environmental issues associated with coffee
> Climate change crisis:
Coffee requires very specific temperatures and conditions to grow. Arabica must be kept at 18-21 degrees with cool down periods (cooler nights) and adequate but not too much rainfall. The best conditions are found in Colombia, where certain elevations create prime conditions. However, the region has warmed by 1.2 degrees since 1980, causing some crops to overheat and farms to be no longer viable.
As tropical regions are disproportionately affected by climate change, some regions will no longer be able to grow their staple crop, coffee.
Farmers are opting to grow the “easier” Robusta crop (rather then Arabica, which requires specific temperatures). Robusta yields much lower profits, leading to poverty for farmers, and the “Global Coffee Crisis” in 2002, when coffee prices, and profits, were lower than ever in history.
Ethiopia is expected to lose 60% of its coffee producing capability by 2060, with disastrous effects for peasant coffee farmers and coffee supply worldwide.
> Threat of extinction:
All major coffee producing countries have been affected by the fungal disease “Coffee Leaf Rust”. The 2011-2012 Central America outbreak caused US$3.2 billion in damage and lost income. Over 60% of species are threatened with extinction, putting pressure on farmers to meet increased demand for the crop. Wild coffee species – and wild varieties of the commercial species – are almost all in decline due to competition for land use and overharvesting of the coffee plant for timber or firewood.
“Half of the world’s coffee could be gone by 2050” – https://www.youtube.com/watch?v=BbxAt1ldZ0c&ab_channel=VICENews
> Other Environmental Issues
-effluent release
-fertiliser use, affects flora, fauna, groundwater
-intensive water use, leading to shortage and disputes between communities
-habitat destruction
-displacing local communities
-human rights, worker exploitation
–carbon emissions associated with flying to usa and eu (roughly 15% of GHG emissions in coffee’s lifecycle attributed to international transportation)
Leave a Reply